by Patrick Kerrigan, . Tags: Php Web Performance Aws
AWS X-Ray is an application monitoring tool by Amazon Web Services that allows you to get an insight into how your applications are performing in production. It also allows you to see how your applications interact with each other, with external services, and with some of AWS' own services. All that's required is to add some instrumentation code at key points in your application. Despite lack of official support, it can be used with PHP.
Why X-Ray?
While X-Ray might not be as feature rich out of the box as the big names in APM, it comes with the usual "pay for what you use" pricing model you'd expect from AWS and can work out orders of magnitude cheaper. It also provides a comprehensive API that you can build on top of to expand its features by taking advantage of other products such as Lambda and CloudWatch to build and graph your own metrics, trigger alerts, and perform automated tasks based on how the application is performing in real-time.
Getting started
First you need to make sure you have an AWS account. If you don't, head to AWS now and set one up. The rest of this post will assume that you have an account.
Depending on whether you host your application within AWS or with an external host, you'll need to set up some credentials to allow the machine running your application to publish traces to X-Ray. This will be an Instance Role if you're using AWS, or a User with API keys if you're not. Whichever is applicable to you, it must have the "AWSXrayWriteOnlyAccess" policy attached to it.
The X-Ray Daemon
In order to avoid blocking your web requests while calls to the AWS API are made to publish traces, AWS provides a background process, the X-Ray Daemon, which receives traces from your application over a non-blocking UDP socket and relays them to AWS on its behalf. Once you've got your credentials set up you'll want to go ahead and install the X-Ray Daemon by following Amazon's set-up guide. You can install the daemon on every machine that hosts your application, or you can install it on one central machine depending on what works best for your environment.
Installing the instrumentation library
Unfortunately, at the time of writing, Amazon doesn't support PHP as a language on X-Ray by default and so there are no official instrumentation libraries available. Thankfully they do provide clear documentation around the protocol for communicating with the X-Ray Daemon, and I was able to put together a simple PHP library that implements it (source code available on GitHub). Go ahead and grab this from composer:
$ composer require pkerrigan/xray ^1
Starting and ending traces
Now you've got the instrumentation library installed, the first step is to set up tracing as early on as possible in your application. To get the most accurate timing information I like to do this in my index.php file. To do this, place the following code where you'd like your tracing to start:
\Pkerrigan\Xray\Trace::getInstance()
    ->setName('my-app')
    ->setUrl($_SERVER['REQUEST_URI'])
    ->setMethod($_SERVER['REQUEST_METHOD'])
    ->begin(10);
The "10" argument to begin is the percentage of requests you'd like to send to X-Ray. The default is 10% but feel free to change this to suit your individual requirements.
Next, place the following code where you'd like tracing to end:
\Pkerrigan\Xray\Trace::getInstance()
    ->end()
    ->setResponseCode(http_response_code())
    ->setError(http_response_code() >= 400 && http_response_code() < 500)
    ->setFault(http_response_code() >= 500)
    ->submit(new \Pkerrigan\Xray\Submission\DaemonSegmentSubmitter());
Here we're basing the error status of the request on the HTTP response code generated by the application. It's possible to use your own logic to determine if there's been an error, so feel free to tweak this to suit your needs. Also notice the use of the built in DaemonSegmentSubmitter; this will send your trace to an X-Ray Daemon running on the local machine by default, but also accepts a hostname and port as constructor arguments if you've opted to install the Daemon on a different machine.
Tracing external calls
To get the most value from X-Ray you'll want to trace external calls from your application such as SQL queries. To do this, you can create a new "segment" of the trace which starts before you execute your query and ends after it returns. Place the following before your query:
\Pkerrigan\Xray\Trace::getInstance()
    ->getCurrentSegment()
    ->addSubsegment(
        (new \Pkerrigan\Xray\SqlSegment())->begin()
    );
And then after your query has been executed:
\Pkerrigan\Xray\Trace::getInstance()
    ->getCurrentSegment()
    ->setName('db@localhost')
    ->setDatabaseType('PostgreSQL')
    ->setQuery($sqlQuery)
    ->end();
Replace the hostname and database type with those correct for your application, and ensure that the query you pass in is sanitised and has no personal data.
Ideally if you're using an ORM or database abstraction layer you can use its profiling hooks in order to execute the above code so you don't have to wrap every query individually. This is beyond the scope of this post though, so I won't go into that here.
Viewing your traces
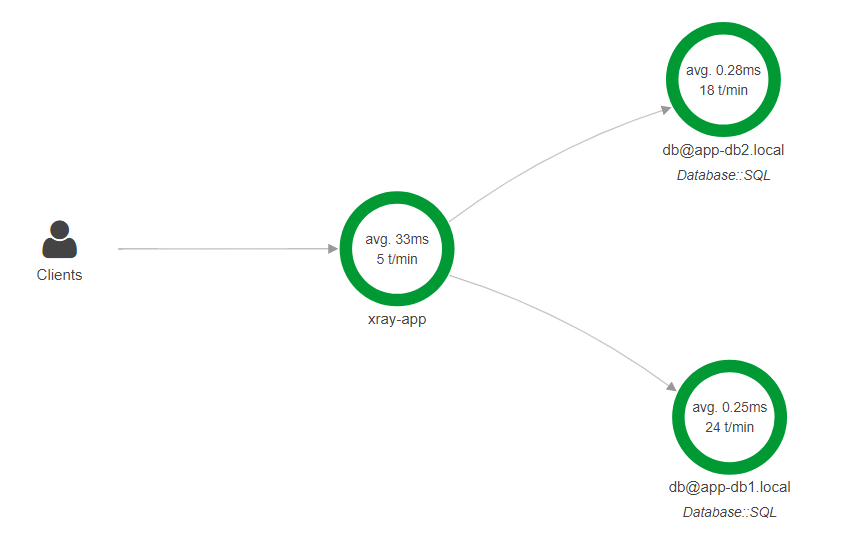
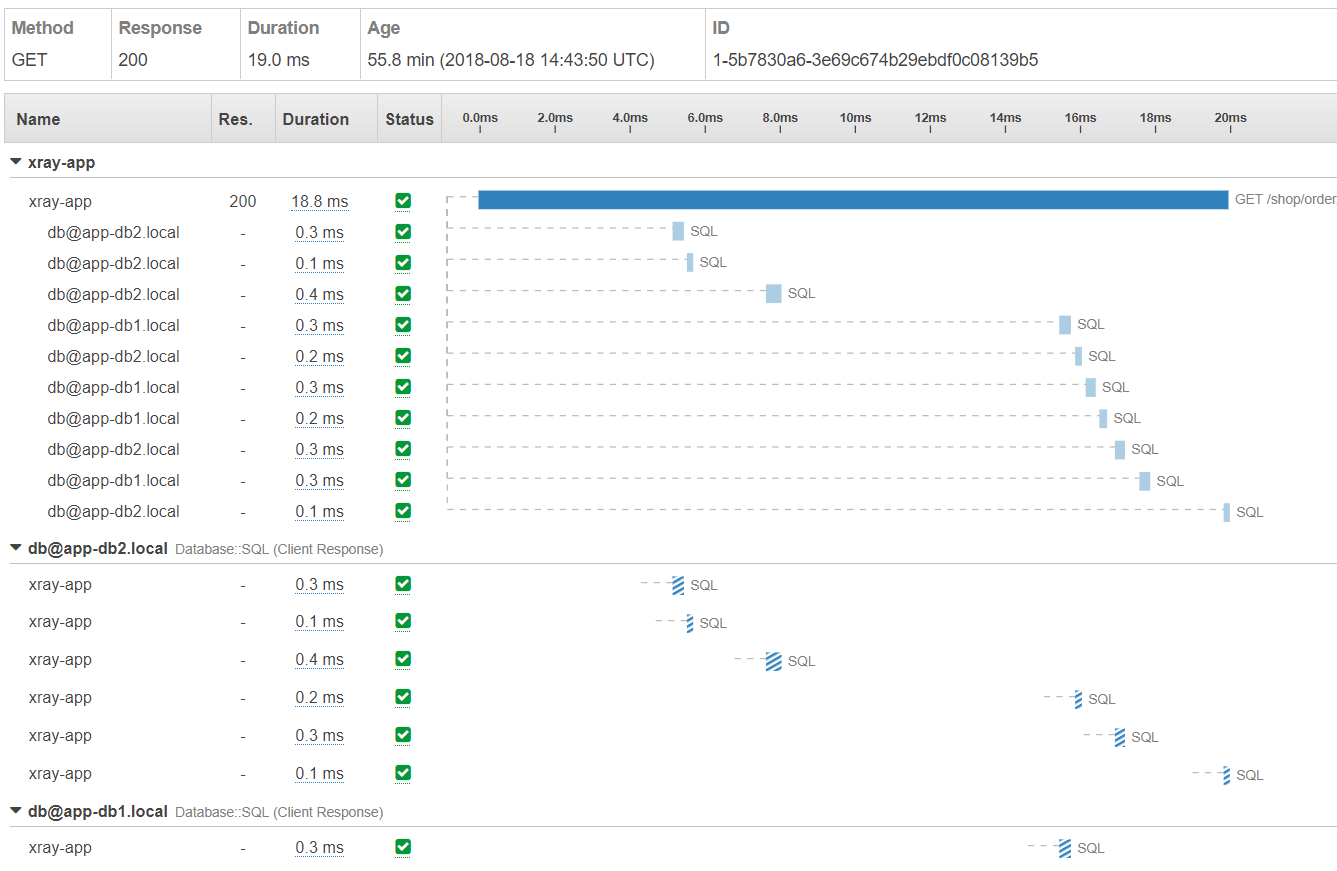
Load up your application and start making some requests, then head over to the X-Ray section of the AWS management console and you should be able to see your trace data appearing. The service map will show how your application is interacting with external systems and provides some response time and error statistics. The traces section will allow you to drill down into the requests that your application has traced and see where the most time is being spent.
Building on X-Ray
Once you've got X-Ray up and running there's plenty of enhancements you can make to get the most out of your data. Try playing around with the API to retrieve the performance statistics and produce some graphs for application response times, request rates and error rates. Push some data to CloudWatch and set up alarms to notify you if your application is performing poorly. Hopefully we'll also start to see some new features rolled out by Amazon or even official support for PHP.